Once upon a time, there was a town in Prussia, called Königsberg, which straddled the Pregel River (this town is now called Kaliningrad and belongs to Russia). As shown below, in part of Königsberg the Pregel river consisted of two parts which flowed around an island after which the river joined and flowed to the sea. As a result, the Pregel river divided Königsberg into four parts. In the picture shown below, these parts are labeled A, B, C, and D. These four parts of Königsberg were connected by seven bridges as shown in the diagram. An old mathematical puzzle asked the question whether a person could stroll through the city of Königsberg crossing each of the bridges exactly once and end up in the same place they started.
In 1736, Leonhard Euler (1707-1783) published a paper titled the Seven Bridges of Königsberg. In this article, Euler gave a proof that it is not possible to stroll through the town of Königsberg crossing each of the seven bridges exactly once regardless of whether or not the person ended up at the place they started. Euler’s mathematical approach to solving this problem is widely accredited with giving rise to a field of mathematics known as graph theory. Today, graph theory has important applications in a number of fields of study including: computer science, chemistry, biochemistry, electrical engineering, operations research, andsocial sciences.

What is a Graph?
In mathematics, a graph is formally defined as a set of vertices (V) and a set of edges (E). Vertices are also referred to as nodes and edges are also referred to as links, arcs, or lines.
An edge is a grouping of two vertices. Typically, this grouping is expressed using tuple notation. For example, let v1 and v2 denote two vertices. The tuple (v1,v2) denotes an edge connecting v1 and v2.
We write G = (V,E) to indicate that the graph, whose name is G, consists of the vertex set V and the edge set E. In this Bricklayer special project, when we use the term graph we are referring to such an artifact. Aside: It should be noted that in other contexts the word graph can be used to refer to things like bar charts, pie charts, and line graphs.
Example
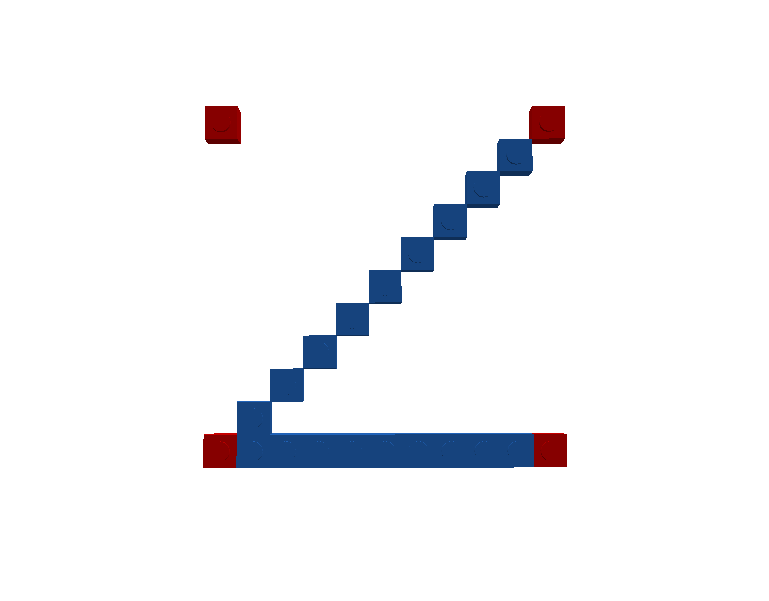
The following example shows a graph whose vertices are points in a two dimensional coordinate space. The graph (G) consists of set of 4 vertices (V) and 2 edges (E). Note that, in the graph below, the vertex (0,10) does not belong to any edge (i.e., it is not connected through an edge to any other vertex).
| V = { (0,0), (0,10), (10,0), (10,10) } |
| E = { ((0,0), (10,0)), ((0,0),(10,10)) } |
| G = (V,E) |
The image below shows the graph G in pictoral form. Note that, in this representation, an edge is depicted as a line segment connecting a pair of vertices.

Undirected Graphs
An undirected graph is a graph whose edges are undirected. An edge is undirected if the orientation of the vertices in its grouping does not matter. Let v1 and v2 denote two vertices. In an undirected graph, (v1,v2) and (v2,v1) both denote the same undirected edge. That is, (v1,v2) = (v2,v1).
Directed Graphs
In a directed graph (also called a digraph), the orientation of vertices in an edge does matter. Let v1 and v2 denote two vertices. In a directed graph, (v1,v2) ≠ (v2,v1). Pictorially, the directed edge (v1,v2) is typically represented as an arrow starting at v1 and pointing to v2.
The loop – A special kind of edge
A loop is an edge that connects a vertex to itself. Let v denote a vertex. The edge (v,v) is a loop. Whether or not a graph allows loops is generally considered significant and is therefore (oftentimes) explicitly mentioned. For example, one can talk about the set of (un)directed graphs containing loops, or about the set of (un)directed graphs that do not contain loops.
Multigraphs
A multigraph is an undirected graph in which two vertices can be connected by multiple edges. In this case, the edges of the graph are represented as a multiset – a kind of set which can contain repeated elements. For example, let v1 and v2 denote two vertices. In a multigraph, the edge (v1,v2) could occur multiple times in the edge set (technically speaking, the edge multiset) of the graph.
Simple Graphs
A simple graph (also called a strict graph or just plain graph for short) is a graph that satisfies the following properties:
- edges are undirected,
- edges only connect distinct nodes (i.e., loops are not permitted), and
- any two nodes can be connected by at most one edge.
The maximum number of edges in a simple graph having n nodes is n(n-1)/2. A simple graph that has this maximum number of edges is called a complete graph.
The degree of a vertex
The degree (or valency) of a vertex is equal to the number of times that vertex appears in an edge in the graph. Symbolically, the degree of a vertex v is denoted deg(v).
Example
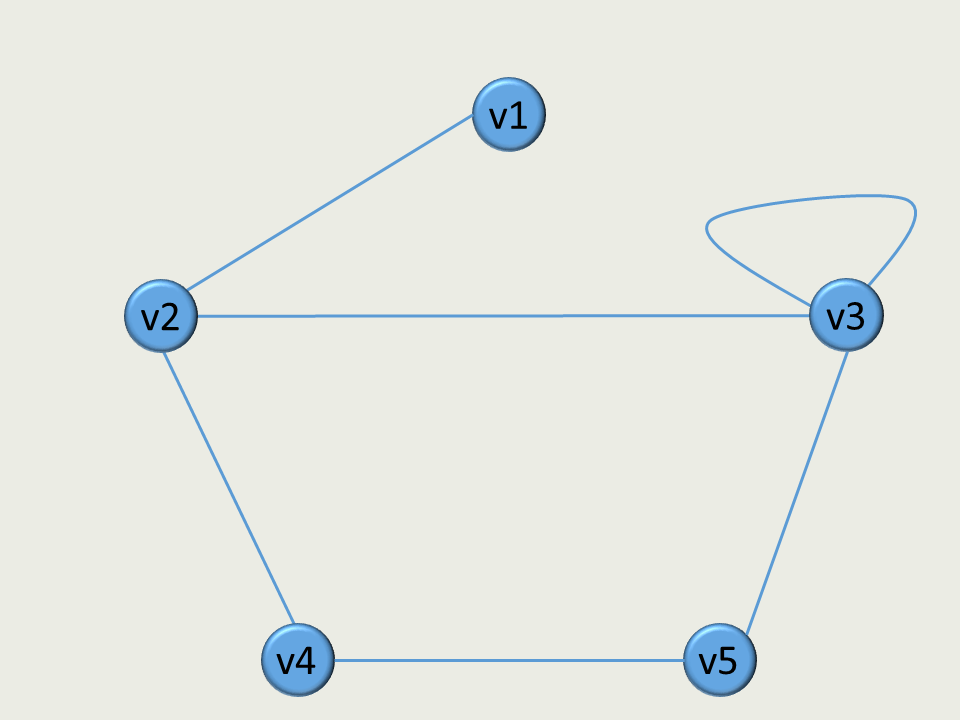
| V = { v1, v2, v3, v4, v5 } |
| E = { (v1,v2), (v2,v3), (v2,v4), (v4,v5), (v3,v3), (v3,v5) } |
| G = (V,E) |
| deg(v1) = 1, deg(v2) = 3, deg(v3) = 4, deg(v4) = 2, deg(v5) = 2 |
The image below is a pictoral representation of the graph. From a visual standpoint, the degree of a vertex can be computed by counting the number of lines that touch the vertex. Note that a loop (e.g., (v3,v3)) touches its vertex twice.
Walk
A walk is a sequence of 2 or more vertices connected by edges. When given a pictoral representation of a graph the alogrithm for constructing a walk is simple: One takes a highlighter places it on a vertex and then moves the highlighter across an edge to another vertex. This process of moving from one vertex to another across an edge can be repeated as many times as desired. The length of a walk is equal to the number of edges it contains.
Example
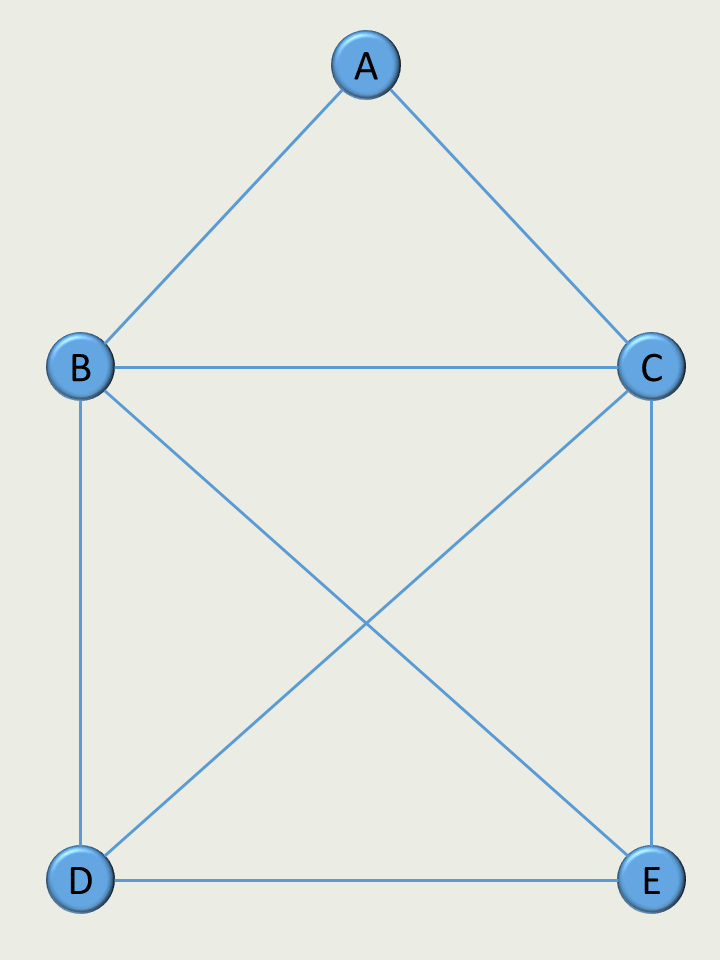
Consider the graph G = (V,E) shown below where V = {A,B,C,D,E} and E = { (A,B), (A,C), (B,C), (B,D), (B,E), (C,D), (C,E), (D,E) }. In the figure, yellow highlighting is used to show a walk between the vertices A and E. It should be noted that this pictoral representation does not indicate where the walk starts and ends. For example, the walk could start at A and end at E, or the other way around. 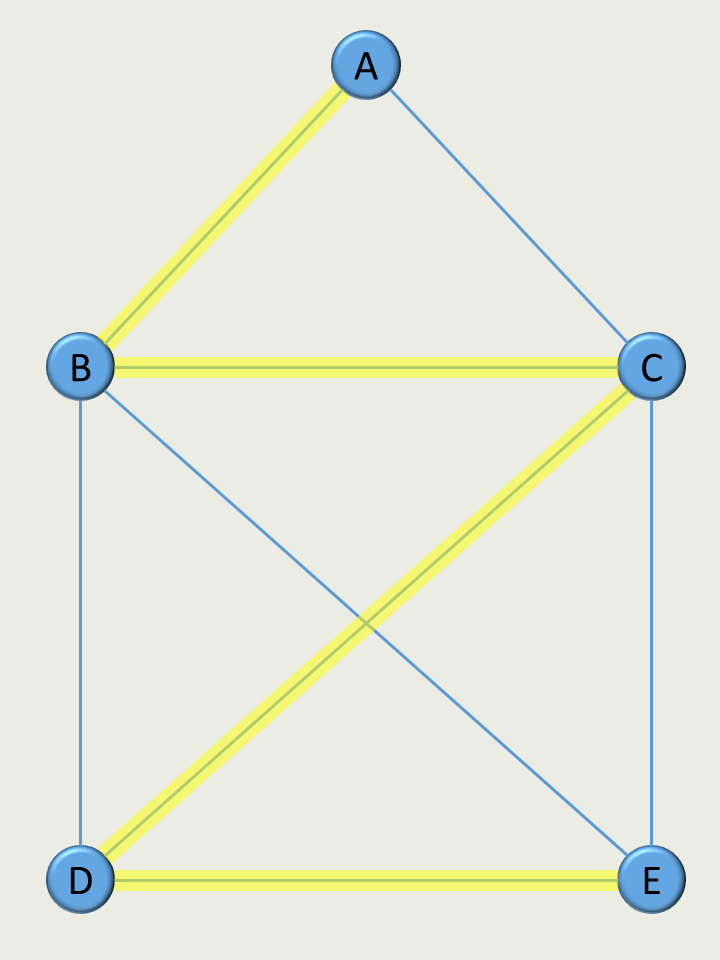
Describing a walk in symbolic terms amounts to writing down in a sequence the vertices and edges in the order they are touched by the highlighter. The walk shown in the figure above can be symbolically described as follows.
Note that this symbolic description of the walk resolves the uncertainty surrounding which vertex is the starting point of the walk. The symbolic description given describes a walk that starts at the vertex A and ends at the vertex E.
In general, the symbolic description of a walk is an alternating sequence of vertices and edges which begins and ends with a vertex. In addition, in order to be well formed, an edge must connect the vertex that comes before it (in the sequence) with the vertex that comes after it.
The Path – A special kind of walk
A walk which has the property that all edges and all vertices (except perhaps the first and last vertex) are distinct is called a path. In pictoral terms, this means that our highlighter can color an edge or vertex at most once (with the possible exception of the first/last vertex.)
Eulerian Paths and Circuits
An Eulerian path is a walk having the property that each edge of the graph is used exactly once. If an Eulerian path has the additional property that its start vertex and end vertex are equal (i.e., the Eulerian path ends where it starts), it is called an Eulerian circuit. Note that every Eulerian circuit is also an Eulerian path, but not every Eulerian path is an Eulerian circuit.
Example
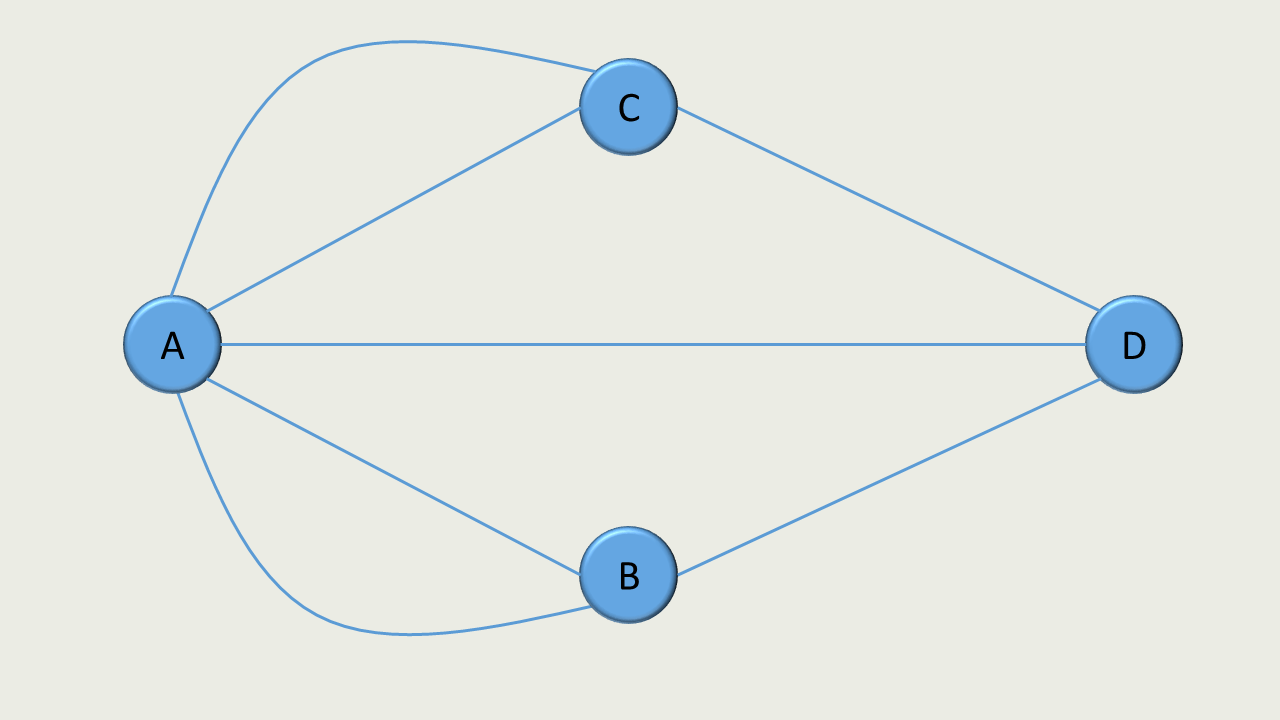
There is an old German children’s puzzle called “Das ist das Haus des Niklaus”, which translated into English is “This is Santa Claus’ house”. The goal of the puzzle is to find an Eulerian path in the graph shown below.
In this example, we will describe a walk symbolically in a compressed form as a sequence of vertices (i.e., we omit edges from our description). For example, the vertex sequence DCA describes a walk that begins at the vertex D, traverses the edge (D,C) to get to vertex C, traverses the edge (C,A) to get to the final vertex A.
Using this notation, the walk DCABEDBCE is a solution to the “Das ist das Haus des Niklaus” puzzle. It turns out that there are many Eulerian paths which are solutions to this puzzle (88 in all). It is interesting to note the following:
- No solution is an Eulerian circuit.
- Every solution begins with either the vertex D or the vertex E.
- If a solution begins with the vertex D, then it ends with the vertex E.
- If a solution begins with the vertex E, then it ends with the vertex D.
Why do the vertices D and E play such specific roles in the solution to the puzzle? What makes these vertices different from the others? The answer is that D and E both have a degree equal to 3. More generally, the degree of both of these vertices is odd while the degree of all the other vertices in the graph is even!
Back to the Seven Bridges of Königsberg Puzzle – Euler’s Proof
Euler began his analysis by modeling the problem as a multigraph (shown in the figure below) G = (V,E) where V represented the different parts of Königsberg and where E represented the bridges connecting the different parts of Königsberg.
The concept of a walk, in the graph theoretic sense, can then be used to reason about the Königsberg bridge problem. More specifically, in order for a walk to be a solution to the puzzle it must possess the following properties:
- The walk must contain exactly one occurrance of every edge in G.
- The walk must start and end at the same vertex.
Notice that the statement of the problem does not prohibit parts of Königsberg (i.e., vertices in the graph) to be visited more than once. In modern times, this kind of walk is called an Eulerian circuit.
Euler solved the Seven Bridges of Königsberg puzzle by proving a more general theorem about multigraphs. Stated using modern terminology, Euler proved that if a multigraph contains anEulerian path, then at most two vertices in the graph can have an odd degree. Conversley, if the multigraph contains more than two vertices whose degree is odd, then no Eulerian path is possible. Euler also proved that if a multigraph contains an Eulerian circuit, then all vertices must have even degree. Note that the graph which models the Seven Bridges of Königsberg puzzle contains three vertices whose degree is odd. Hence, this graph contains neither an Eulerian path nor an Eulerian circuit. ∎
The intuition behind these findings are as follows. First, let us define an internal vertex as a vertex in a walk that does not occur in the first or last position. In a walk, every internal vertex must bearrived at through one edge and must be departed from using another edge. Thus, the edges associated with an occurrence of an internal vertex within a walk contributes 2 to the degree of that vertex. From this it follows that vertices that only occur as internal verticies must have an even degree. This leaves two vertices unaccounted for, the first and last vertex in the walk.
Bricklayer
This Bricklayer special project primarily concerns itself with simple graphs. In Bricklayer, a vertex can be modeled as a coordinate (e.g., (4,6)) and an (undirected) edge can be modeled as a line(segment) connecting two coordinates. Thus, one representation of a graph in Bricklayer is a set of 1-bit “vertex” bricks (placed at various coordinates) and a set of lines connecting these vertex bricks.
Example
The Bricklayer program below creates a LEGO artifact corresponding to the graph discussed in our earlier example. In this artifact, vertices are red and edges are blue. Also note that vertex points are created after edges have been drawn. This order assures that lines do not overwrite the vertices they connect.
open Level_3;

val dimensions = 32;
val max        = dimensions - 1;

fun graph () =
    let
        (* vertex declarations *)
        val v1 = ( 0, 0)
        val v2 = ( 0,10)
        val v3 = (10, 0)
        val v4 = (10,10)
    in
        (* edges *)
        lineXZ v1 v3 BLUE;
        lineXZ v1 v4 BLUE;

        (* vertices *)
        put2D (1,1) RED v1;
        put2D (1,1) RED v2;
        put2D (1,1) RED v3;
        put2D (1,1) RED v4
    end;

(* ===================================== *)
build2D(dimensions,dimensions);

graph ();

show2D "Graph";