
A code-along is a story about coding in which you are encouraged to “code up” all the examples in the story. In a code-along you shouldnot cut-and-paste.
In this code-along, we will explore how to use the higher-functions tabulate and map to create graphs having a relatively large number of vertices and edges. Graphs, like the ones show here can be tedious to program because of their size. The reason being that hardcoding large amounts of data in a program is both labor intensive and error prone.
In previous code-alongs, we have seen how the function map can be used to eliminate certain kinds of hardcodings as they pertain to graphs. Specifically, map was used to dynamically create point lists from hardcoded integer lists. The function map was also used to dynamically create edges between points and these (dynamically created) point lists. These previous examples, were based on the integer lists, which were hardcoded in the program since they were relatively small.
In this code-along we take our exploration one step further and consider the case where the integer lists themselves are sufficiently large that hardcoding them is impractical. The basic idea we will explore is how to use the tabulate function to dynamically generate large lists of integers. Such lists can then be used by map to create points and edges. We will also explore using tabulate to create lists of points directly (skipping the intermediate step of creating lists of integers).
Example 1
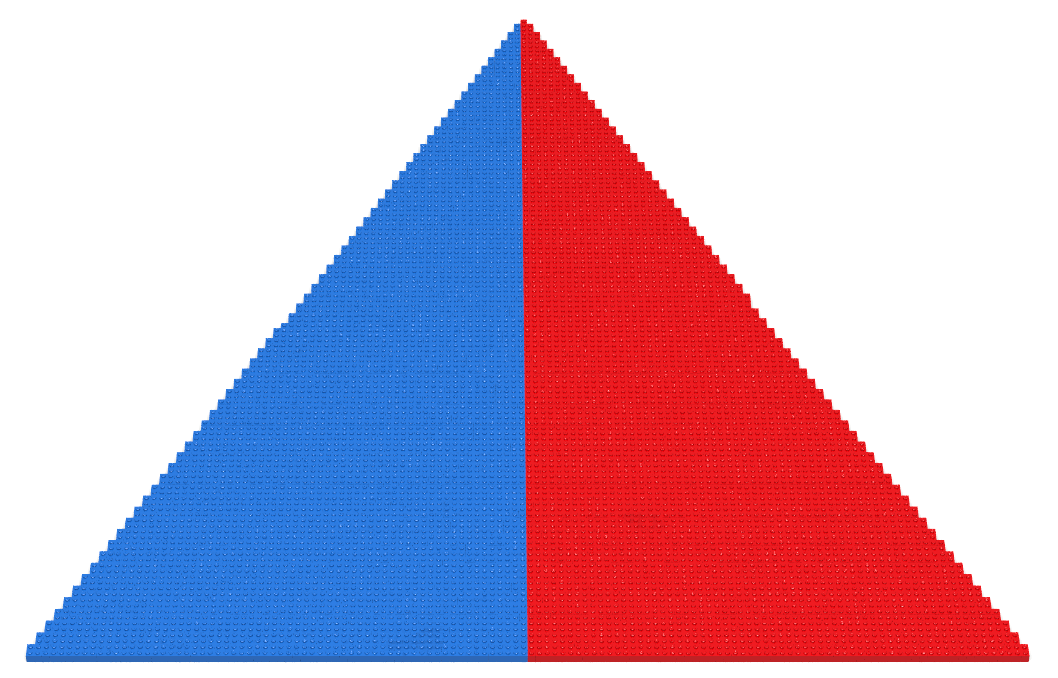
The Bricklayer program in this example creates a graph containing 128+2 = 8 vertices and 2*128=256 edges. In this graph, 2 central vertices c1 and c2 are connected to the 128 peripheral vertices, p0, …, p127. The central vertices are positioned on the lower-left and lower-right corners of the virtual space. The peripheral vertices run along the z-axis down the middle of the virtual space. Peripheral vertices occupy adjacent cells along the z-axis in the virtual space. Because of this the lines connecting the central vertices to the peripheral vertices appear to create solid objects. In this case, two triangular objects are created, one blue and one red. In general, we will use the term dense graph to denote graphs whose edges are so closely spaced that they appear to create solid objects.
In this program, the function tabulate is called (line 8) to generate a list of 128 integers in the range 0, 1, …, 127 . The tabulate function is passed a tuple consisting of two expressions. The first expression is the variable dimensions (declared on line 3) whose evaluation yields the integer 128. The second expression is the variable identity (declared on line 10) whose evaluation yields a function value which simply returns (as its output) the value it is given as its input. For example, the call identity 5 will return 5 as its result.
Once the integer list is (dynamically) created, the map function is used (as done in previous code-alongs) to construct the peripheral vertices and edges of the graph.
open Level_3;

val dimensions = 128;
val max        = dimensions - 1;
val half       = dimensions div 2;

fun graph () =
    let
      fun identity v  = v;
      val integerList = List.tabulate(dimensions, identity);

      fun makeVertex v  = (half,v);
      val vertices      = map makeVertex integerList;

      val c1 = (0,0);
      val c2 = (max,0);

      fun multiconnect b v vs =
          let
              fun connect v1 v2 = lineXZ v1 v2 b;
          in
              map (connect v) vs
          end;
    in
        multiconnect BLUE c1 vertices;
        multiconnect RED  c2 vertices
    end;

(* ===================================================== *)
build2D(dimensions,dimensions);

graph ();

show2D "Graph";
It should be noted that tabulate be used in more general ways than what is shown the example above. The function tabulate can be seen as simultaneously creating a list of integers to which a given function is applied. Thus, tabulate behaves similar to map. Knowing this lets us simplify the code used to create the peripheral vertex list in the example above (lines 7-10). The two lines of code shown below creates this same peripheral vertex list.
fun makeVertex v = (half,v);
val vertices = List.tabulate(dimensions, makeVertex);
Example 2
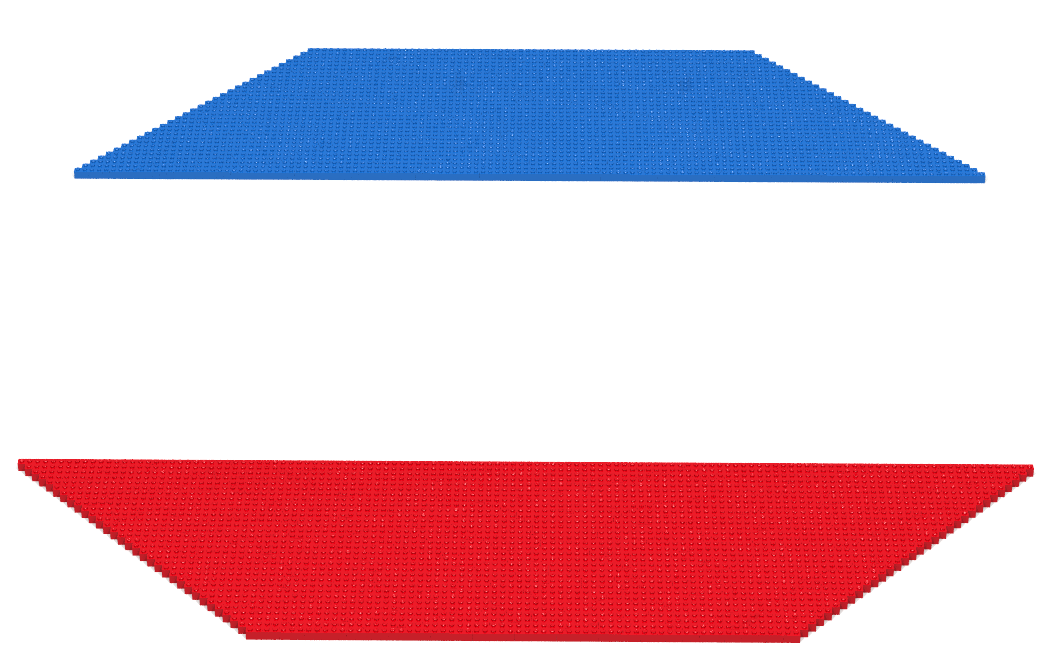
The Bricklayer program in this example creates the dense graph shown below. Here, the tabulate function is used to create two lists whose elements are vertex pairs. The map function is then used to draw lines between these vertex pairs.
Note that the upperDiagonals function (line 8) translates integer values in the range 0, 1, …, 31 to vertex pairs. Similarly, the lowerDiagonals function (line 10) translates integer values in the range 0, 1, …, 31 to vertex pairs. The vertex pair sequences created have the following properties.
- The z-values of the vertices in a vertex pair are equal. In the first list the z-values are increasing while in the second list the z-values are decreasing.
- Both vertex-pair lists begin with a vertex pair where the x-value of the first vertex is 0 and the x-value of the second vertex is the maximum value for x.
- Over the course of the vertex-pair list, the x-value of the first vertex is increasing while the x-value of the second vertex is decreasing. This means that, the vertices in a vertex-pair are moving closer to each other (with respect the x axis) over the course of the list.
open Level_3;

val dimensions   = 128;
val max          = dimensions - 1;
val quarter      = dimensions div 4;
val threeQuarter = 3*dimensions div 4;

fun graph () =
    let
        fun upperDiagonals v =
             ( (v,threeQuarter+v), (max-v,threeQuarter+v) );

        fun lowerDiagonals v =
             ( (v,quarter-v), (max-v,quarter-v) );

        val upperVertexPairs =
             List.tabulate(quarter, upperDiagonals);

        val lowerVertexPairs =
             List.tabulate(quarter, lowerDiagonals);

        fun multiconnect b vertexPairList =
            let
                fun connect (v1, v2) = lineXZ v1 v2 b;
            in
                map connect vertexPairList
            end;
    in
        multiconnect BLUE upperVertexPairs;
        multiconnect RED  lowerVertexPairs
    end;

(* ===================================================== *)
build2D(dimensions,dimensions);

graph ();

show2D "Graph";